Feeds:
Posts
Comments

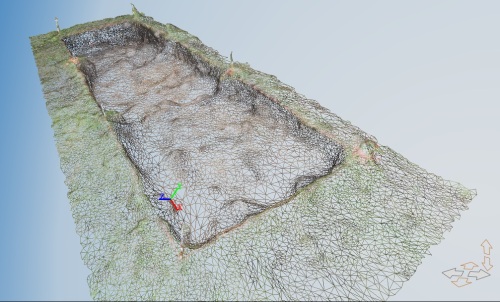
On Wednesday we completed excavation for the 2012 season. The AlDf-30 site proved to be far more complex than we had anticipated. In addition to two superimposed dwellings floors, we encountered an enigmatic depression in the subsoil which incorporated a robust boulder and cobble feature. To our knowledge, there are few analogous structures in the known archaeological literature from the Maritime Peninsula – a fascinating puzzle to end our fieldwork at Port Joli!

We have formulated several hypotheses about what it could be, but it would be premature to make any firm determination before further analysis. We will analyze all of the data we’ve collected in the lab, including a careful study of the artifact patterning within the feature, before making an interpretation about its function. In the meantime, we have found it very useful to visualize the structure in 3D to understand its overall shape and the internal arrangement and orientation of the rock feature. Below, I’ve uploaded a video of the 3D model we have created. Similar to previous posts, this 3D model was compiled using 123D Catch, and was created from over 60 high resolution digital photographs of the feature.

One of the primary aims of the E’se’get Archaeology Project is to understand the economic and spiritual relationships between ancient Mi’kmaq and the other animals that inhabited the South Shore ecosystem. Shell middens are perfect archaeological deposits to explore these relationships because the calcium carbonate in bivalve shells leaches into Nova Scotia’s normally acidic soils, preserving vertebrate remains in excellent condition.

A Port Joli shell midden. These deposits preserve bone in Nova Scotia’s destructive acidic soils.

For several years I have been working with colleagues at Idaho State University to produce an online vertebrate reference collection to aid in the identification of animal bones from archaeological sites. VZAP replicates all of the  functionality of a real vertebrate reference collection by providing high resolution 2D images and 3D models of the skeletons of northern fish, bird, and mammal species.  The website is designed to provide an aid to researchers with incomplete collections or who are in field situations where reference collections are not available. We have been using VZAP to make some preliminary identifications of the animal bones coming from the middens; these identifications assists us with selecting bone for dating purposes (terrestrial mammal bone often gives more accurate radiocarbon dates) and aids our ongoing assessment and interpretation of site function and seasonality in the field.

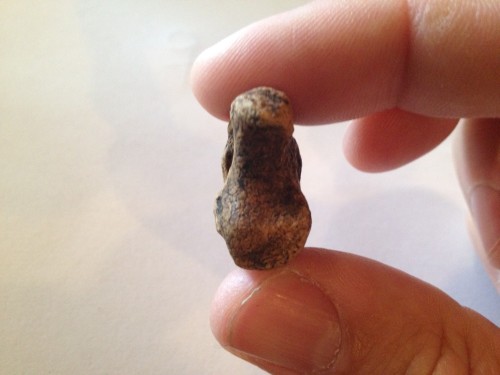
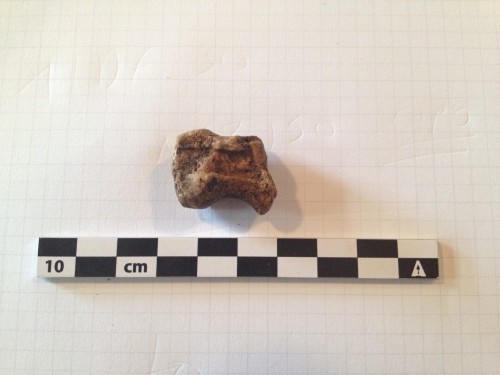
An intact mammal bone recovered from a Port Joli shell midden. I have a good idea that it is a carpal (wrist bone) from an ungulate (hoofed animal), but I need to compare it to the bones of multiple taxa to identify the species.


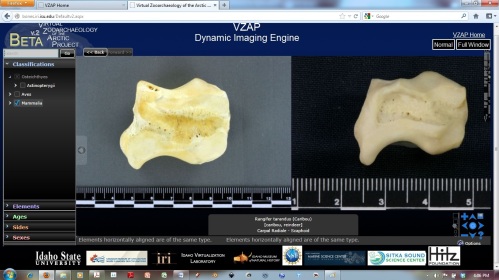
A screen capture of the VZAP image wall. VZAP allows for comparison of the same bone element from multiple species simultaneously. Here the left radial carpal (a wrist bone) of caribou (Rangifer tarandus) and Moose (Alces alces) are being compared. While both are similar, the bone on the right (caribou) appears to be the best morphological match for the archaeological specimen.

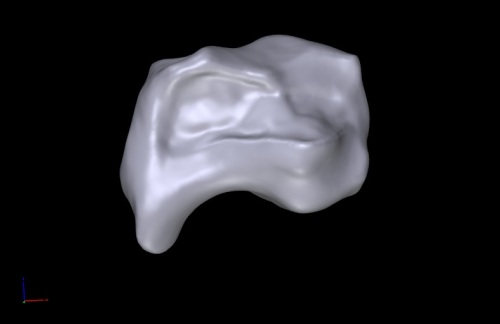
A screen capture of the lateral view of a 3D model of a caribou radial carpal. It compares well with the archaeological bone, though it is the opposite side (i.e. left versus right). It also has some minor morphological differences, probably because the model is from a different population of caribou (resident Nova Scotia caribou were a woodland subspecies and this bone is from a tundra subspecies).

Corresponding distal view of the archaeological specimen. The specimen is root etched and eroded from being buried for roughly 1500 years; however, enough morphological features are visible to identify it.


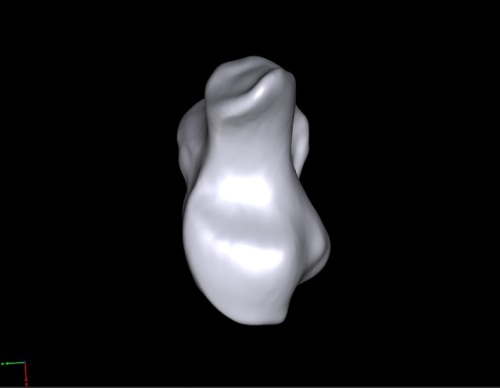
The distal view of the 3D model of a caribou radial carpal (compare to above).

This specimen will undergo further comparison in the lab, but this quick analysis provides a good basis for identification. VZAP is an evolving database, which currently includes nearly two hundred species of mammals, birds, and fish.  You can discover more about VZAP, and test it for yourself, by visiting the website: it is free for researchers and the general public to use and explore.

We have been working hard over the past three days and we have finally reached the lower limits of the cultural deposit at AlDf-30. While the crew has been steadily troweling away at the final units, Gabe and I have been busy mapping the basal levels of the deposit and drawing the site profiles (records of the soil stratification in the deposit). As discussed earlier, we’ve been using the iDraw app to create many of the drawings and maps for the deposit.

By working on a graph paper-like background, which I described in an earlier post, you can create extremely accurate section profiles with iDraw. To draw each soil layer interface we use the pen tool and plot each data point across each level sequentially. The pen tool allows for curves to be created simply by holding and sliding the stylus on a plotted point, which permits the creation natural contours. Labeling the map only takes a few moments and complex colours, fills, and shapes can be easily added. The end result is a vector-based map created in the field which is near publishable quality. A few minutes of clean-up with any desktop illustration package and these maps can be inserted directly into a report or publication.

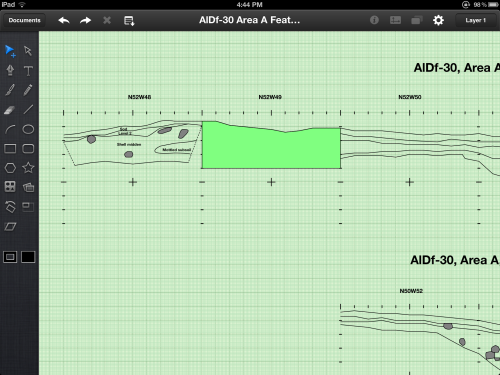
A screen capture of some of the profiles produced in the field with iDraw. For the complete profile drawings you’ll have to read Gabe Hrynick’s dissertation.

Our mapping on the iPads has resulted in a few observations. First, we have found that the Jot brand styli aren’t suited for fieldwork. Dust and debris often coat the screen protectors and this gets caught between the Jot’s plastic disc and the screen, resulting in some fairly severe scratches on our iPad screen covers. We have found that a (much cheaper) Pogo stylus with a foam tip is far superior; it is both more accurate and leaves no scratches even when the iPads are dusty. Second, we are happy to report that the iPads, with their protective cases, work very well in the rain. Water droplets don’t impede visibility and don’t appear to inhibit the capacitive touch screen in any way. While our protective cases are water resistant, in heavy downpours we put the iPads in plastic bags and simply draw through the plastic. This works so well that yesterday we mapped a significant portion of the AlDf-30 feature through a plastic bag.

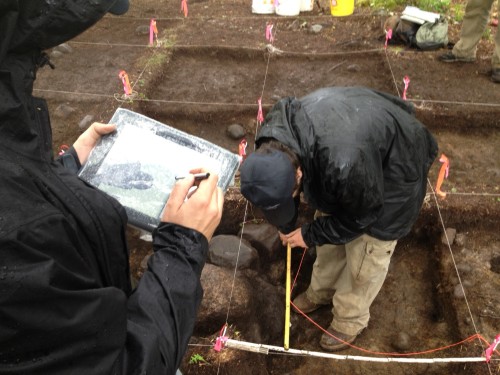
Mapping with iPad and iDraw in the rain  (note the plastic bag). Archaeologists always have what they need to protect their iPads from the rain – artifact bags.

Now that AlDf-30 is finished, we will be moving on to other sites in the harbour. Just two more sites to test and the field season will be complete. In fact, this is the first time in the history of the project where we will have met all the goals of a specific season – I’ve had a good crew and we’ve had very lucky weather. Gabe in particular has had a great result for his thesis. We spent nearly four weeks carefully digging the house deposit and we have uncovered at least three superimposed structures, all of which he’ll interpret over the course of his dissertation.

Archaeology is often a slow, labour intensive, process; we have been digging at the house floor in the cranberry bog for three weeks now, and the video below shows how we spend a typical two hours. You will note that we often spend more time measuring, writing, and recording than we do moving dirt. Because archaeology is destructive, we have to be very meticulous in our documentation procedures – the site is destroyed in the archaeological process and we cannot go back if we miss anything. We are also putting more effort into the excavation of this dwelling than in a typical project by screening all sediments through 3mm mesh to increase recovery of small bones and artifacts, piece plotting all formal artifacts, and excavating and bagging all materials by 25 cm quadrants within our 1m x 1m grids. We have discovered that careful documentation of the position of all the artifacts can tell us much about how ancient Mi’kmaq organized their space inside wigwam-like dwellings.

The video below was recorded over two hours, between 8:45 AM and 10:45 AM, on July 26th. The video incorporates over 4000 individual photographs.

Despite all the tedium of measuring, recording, and mapping, we’ve been finding some interesting artifacts, particularly in the chipped stone assemblage.

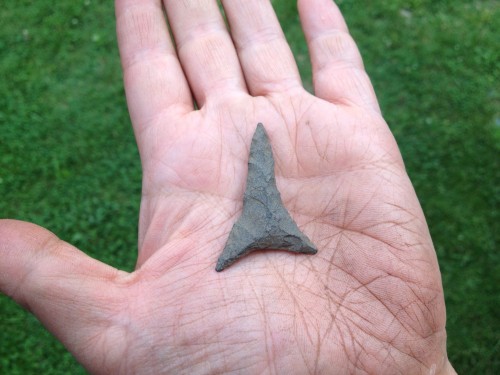
Today Katherine recovered a stone projectile point similar in style to a point we found earlier in the excavations (see below). These are the only two points of this type that we have found in four years of excavation in Port Joli.

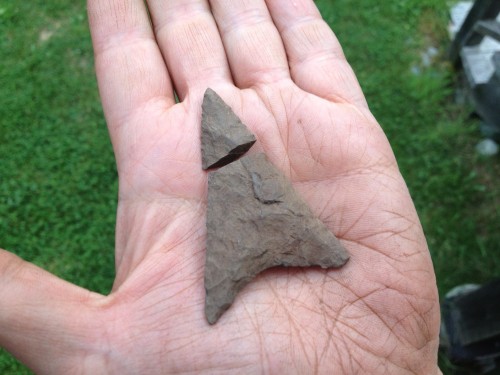
When a projectile point is broken in the past, the corresponding piece is often never found. Yesterday Natalie found the matching tip to a projectile point she recovered earlier in the dig (see post here). The tip of point was over a metre away from its base, but was found at a similar stratigraphic level.

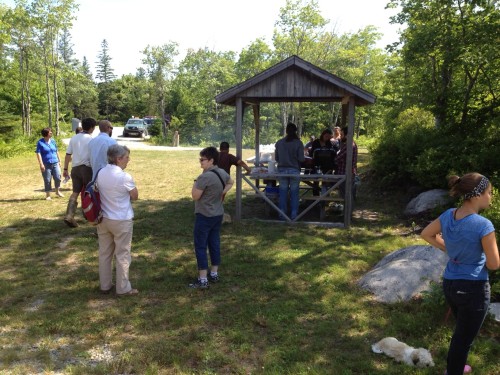
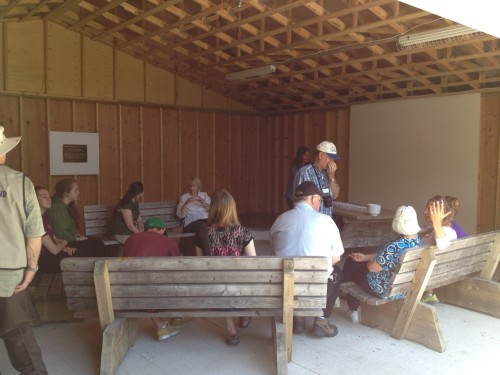
As discussed in previous posts, the E’se’get Archaeology Project is designed as a community archaeology project, with significant input from Acadia First Nation and other stakeholders.  On Monday and Tuesday, with generous assistance from the Nova Scotia Department of Natural Resources, we hosted Mi’kmaw “Community Archaeology Days” in Thomas Raddall Provincial Park. The events consisted of a tour of the current archaeological excavations, followed by an opportunity to see the artifacts recovered to date, and finally a barbeque prepared by my crew and collaborators (who all did an amazing job).

Acadia First Nation members at the community event. The crew can be seen barbequing in the background.

Community members and park staff discuss the project.

Unlike a formal lecture, these events are a great opportunity to meet community members and discuss the project with them face to face. Often the conversations lead to their recounting oral histories heard from elders, or experiences of finding archaeological materials on their properties and/or journeys. Such interaction can lead to organic development of new research questions and strategies, as community members discuss the subjects that interest them about the past. This is the basis of community archaeology – directly involving the community in shaping new research designs and projects, while communicating the results of the archaeology as it is being discovered.

By: Gabe Hrynick

In his last post, Matt talked about using 123D Catch to generate three-dimensional images of archaeological excavations, and suggested that the software could be useful for recording archaeological features. A focus of E’se’get research since 2009 has been the identification and excavation of ancient Mi’kmaw dwelling features. These features can provide a myriad of information about Woodland period lifeways and social organization. However, because they are relatively large, they present some technical difficulties during excavation.

As discussed previously, we have encountered and exposed the remains of a wigwam-like house floor, which we have labelled Feature 1. Two of the ways archaeologists record features are by mapping and by photography, as Matt described in earlier posts. A challenge of photography, however, is to capture the necessary angles to document the floor properly. Natalie, who handles much of the project photography, took over 50 photos of the floor from various angles. This was a task made challenging by the frequently mottled lighting at the site. To get more angles, she even climbed a tree.

Using these photos and software from 123D Catch, we were able to produce this 3D model of the floor, which allows us to the view the floor from new angles we cannot see on site. We’ve already used this image when discussing the feature and strategizing in the evenings, and suspect that it will continue to be a valuable tool for visualizing the feature in our research and presentations.

I’m currently involved in a project with my colleague, Dr. Terrence Clark, to apply virtual reality technology to the Canadian Museum of Civilization’s exhibits. As part of this project we’ve been experimenting with the use of 123D Catch, a freeware product that produces highly realistic 3D models from ordinary digital photographs.

The following images show a test of this technology on the archaeological units that we excavated at AlDf-06 earlier in the week. I’m very impressed by this render; it displays the topography of the site extremely well, and I believe it holds great promise for documenting archaeological features in a more comprehensive manner.

Digital photo of the AlDf-6 excavation units, facing North.

Screen capture of the same excavation units created in 123D Catch.

Watch the movie below to take a virtual tour of the excavations at AlDf-06. You will notice the undulating surface of the units – this is the result of repeated ploughing of the subsoil (the natural soil surface before the site was inhabited).


Over the past two days we’ve exposed the top surface of the house at the site in the cranberry bog.  Roughly oval in shape, it manifested as a dark soil surface ringed by lighter subsoil deposits. It also had several post moulds (dark soil stains left from upright tent poles) around its circumference as well as internal rock arrangements.
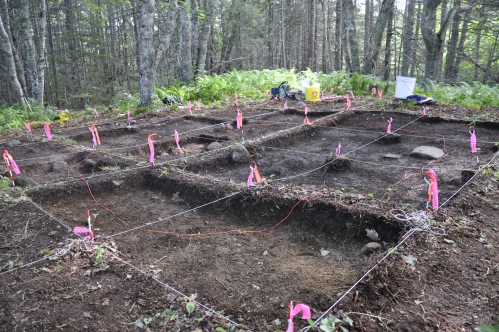
Image of the oval dwelling surface (the floor of a wigwam-like structure), outlined with string. This floor was very difficult to discern and involved careful scrutiny of changes in soil colour inside and outside of the structure (these don’t replicate well in photographs, hence the string). The raised baulks will provide a record of soil layers as they transition through the house floor. Note the dark colour of the interior of the structure.  For a better picture you will have to read Gabe’s upcoming doctoral dissertation!

Mapping these features is difficult and time consuming; every aspect of the feature must be drawn accurately. Archaeologists typically do this with pencil and graph paper (each sheet usually depicts two side-by-side grid units). When we get back from the field, each of these sheets must be scanned and loaded into illustration software to be traced by hand. The traces must then be digitally concatenated and formatted to produce a publication quality map. This process can take days, and it is a source of many transcription errors introduced as hand drawn images are converted to digital format.  This year, however, we are using iDraw on our iPads to map features and draw soil profiles.
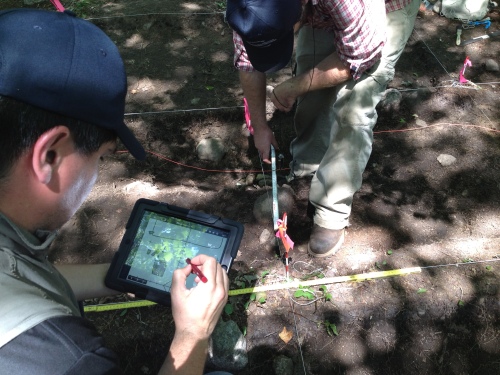
Here I plot features on the iPad as Gabe measures them in relation to the grid system. In my experience, using the iDraw app is as fast as using traditional pencil and paper.

The iDraw app is ideal for archaeological mapping because the canvas (background) can be set to a millimeter grid that perfectly mimics real graph paper.  From there producing a map is as simple as drawing on regular graph paper (we use a stylus to draw on the iPad).  However, iDraw is also a fully featured vector-based illustration app, meaning that it has the ability to produce a completely formatted and polished image (which is near-publication quality) as you are drawing it. We use the iDraw pen tool to do most of our mapping; by holding and dragging each plotted point you can produce curves and other complex outlines. When the “polygon” is closed it automatically fills with the colour of your choice, leading to instant colour coding of rocks, hearth features, etc. Because much of the formatting required for publication can be done while you are mapping, such software will save many days of scanning, tracing, and formatting time in the office.
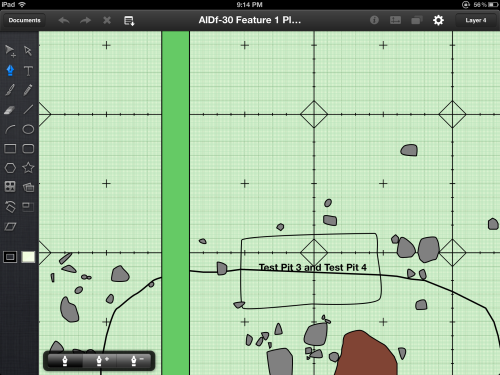
A screen capture of part of the finished map on iDraw. All of the formatting was done in the field during the mapping process. You’ll have to see Gabe’s doctoral dissertation for the complete map!

We found the layering function of the software particularly helpful; it can be used to set background layers (such as our grid unit system) that can’t be modified while drawing other features on a different layer. In our setup the grid units are reproduced on Layer 1, the house outline and other soil features on Layer 2, the rock features on Layer 3, the baulk system on Layer 4, and elevations on Layer 5. This way there is no danger of modifying the data in previous layers by accident as you draw.
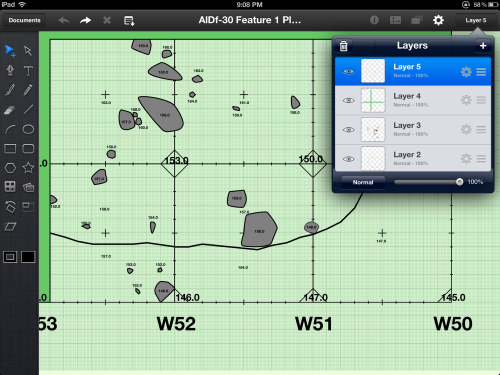
Layers in the final map. Note the elevations plotted for each feature and grid pin.

When I originally began thinking about digital data collection in the field, mapping was the issue that always seemed to be the most daunting and problematic. Existing handheld devices were too small and inaccurate and the available drawing software was rudimentary. With new tablet computers and apps such as iDraw, there is little reason to continue using pencil and graph paper in any archaeological field project where efficiency, accuracy, and cost effectiveness are goals.

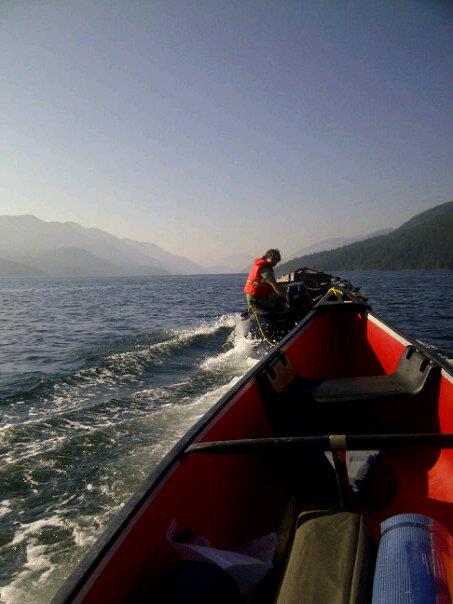
My archaeological colleague at the Museum, Dr. Terrence Clark, is also in the field this year. He is conducting a community archaeology project with Shíshálh band members on the Sunshine Coast of British Columbia. Yesterday, he sent me this email to post on the blog:

“The 2012 field season in underway and the action is in full swing. We are lucky this year to take part in a training program where high school students from the Shíshálh Band are partaking in the excavation. These five youngsters are right in the middle of things, having been equipped with all the tools and the know-how to be real archaeologists.

Terry and his crew travel to the site (Photo by Andrea Gilchrist).

The sun is shining and the breeze is cool; the only thing sinking our enthusiasm is our unfortunate luck with boats. Despite our high expectations of the rented zodiacs, they have not performed according to plan. A piece broke in the motor of our 5-man zodiac right in the harbour of our camp and despite our remote location there happened to be a friendly fisherman and his wife nearby who towed us into town. We were able to order the new part without too much difficulty and now that motor is back in action. Our 8-man zodiac, however, had not gone as far as breaking down but wasn’t performing to its maximum potential. After finally reading the manual it turns out the tilt wasn’t put on properly but with the help of a wrench it too is ready to go. Fingers crossed, our boat troubles are over!”

We’ve spent the last two days working at a site near the head of Port Joli Harbour, instead of at our house floor site in the cranberry bog. We are digging here to gather some animal bones, datable remains, and artifacts to assist us in filling in the cultural sequence for the harbour.  The landowners kindly gave us permission to dig on their property, and we are very grateful to them for letting us spend several days on their front lawn.

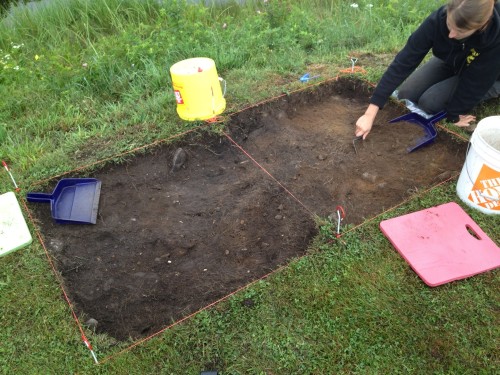
Natalie digs into the nicely manicured lawn. The mottled soil (note the alternating colours) indicates a mixed deposit consisting of cultural soil and subsoil.

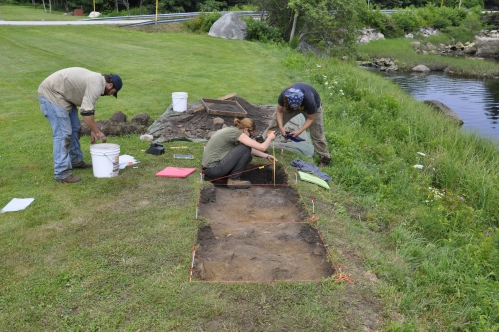
The site has a spectacular view and was the former location of a vegetable garden which was used for decades.  While we knew the site would be disturbed, previous reports indicated that there were undistributed deposits beneath the plow-zone. Unfortunately this has proven not to be the case and the entire deposit appears to have been affected by ploughing.

The crew takes closing depths after excavating three units. Note the undulating nature of the subsoil, caused by repeated ploughing.

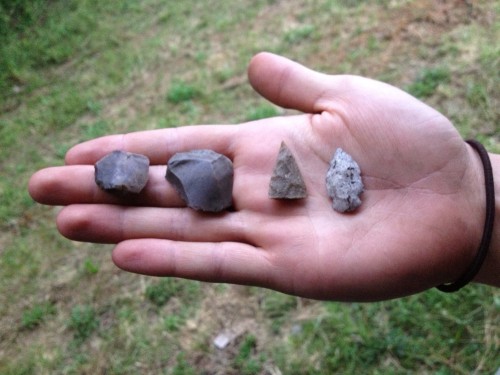
Regardless, we recovered enough animal remains to date the site accurately (we use terrestrial mammal bone for radiocarbon dating), and we found an array of decorated ceramics and chert (stone) artifacts.  We didn’t recover enough animal bones to reconstruct the site’s subsistence patterns with certainty, but with a radiocarbon date and several diagnostic artifacts, we will be able to say much about how the site fits into Port Joli’s archeological sequence.

A selection of artifacts from the site. The two artifacts on the left are scrapers, used for working wood, bark, and bone. The two items on the right are projectile points, probably arrowheads.